Understanding NHM Incidents and Events
The percent of sick people in a community is comparable to the percent of problem devices in a network. If a person is considered 'sick' if they have a temperature, even if they are feeling well, there will be a low percentage of the community that is considered sick at any point in time. The people who are sick will constantly change but the percentage is likely to remain low. If however, the percentage increases to 20% or 30% of the population there is a health problem that should be investigated. This is what NHM Incidents are trying to do for a network.
WBC Network Health Monitor makes a model of the behavior of all the devices. The goal of the model is to compare current network behavior to previous behavior.
Statistics such as min, max, and standard deviation are calculated for each device, for each of the 168 hours of the week. Having statistics for each hour of the week avoids the IntraVUE user/admin from having to configure production vs non-production days and hours.
A 'high normal' value is calculated for each hour. The 'high-normal' value is a value that is expected to be exceeded several times a day compared to the current value. A NHM Incident is generated for a device when it exceeds its 'high normal'.
It is also expected that in any particular minute a few devices will exceed their 'high-normals' but not 'many'. 'Many' is a small network (less than 100 devices) is 30% and in a large network 20%. When the percentage of the devices exceeds the network limit WBC Network Health Monitor creates a NHM Event in the event log.
When 3 of the last 5 minutes have NHM Events, an Alarm is created and an email generated. This alarm alerts the NHM user that something unusual has happened in the network.

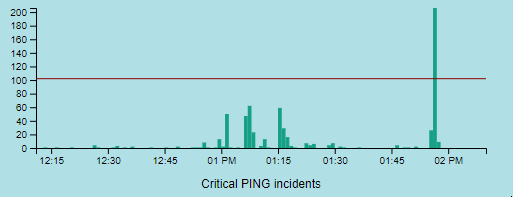
In the image above 2 hours of Ping NHM Incidents are graphed. Many minutes have less than 20 incidents/devices over their 'high-normal' in that minute. In one minute, just before 2pm, the number of incidents exceeded the network limit and results in an NHM Event log entry but not an alarm.
A graph of the hourly statistics for a device is available in NHM Incidents by Device Over-Range and some other dialogs by clicking on the icon below.

IN SUMMARY,
A NHM Incident is when a single device exceeds its high normal value in a minute.
A NHM Event is generated when a percentage of the total devices in a network all exceed their 'high normals'. For small networks the percent is 30%, for larger networks the percent is 20%. During normal operation only a few percent of the total devices will be exceeding the 'high-normals'.
A NHM successive high incident Alarm is generated any time 3 or the last 5 minutes have NHM Events. The alarm is cleared when there are NHM Events in the last 5 minutes.
| Introduction |
|
| Key Features and Benefits |
|
| Getting Started |
|
| Update Intravue |
|
| Notes on User Interface |
|
| Configuration |
|
| Connecting to an IntraVUE |
|
| WBC Network Health Monitor Settings |
|
| Email Settings |
|
| Database Settings |
|
| Real-Time IntraVUE Management |
|
| IntraVUE Status |
|
| IntraVUE Dashboard |
|
| Summary Statistics |
|
| Highest Ping Response Devices |
|
| Highest Bandwidth Devices |
|
| Uptime and Statistics |
|
| Hypertree Network Map |
|
| Tree View Network Map |
|
| Reports |
|
| Device Info |
|
| Alarms and Warnings |
|
| Events |
|
| Threshold Analysis and Configuration Report |
|
| Time Based CRC and IfInErrors Report |
|
| Connection History Report |
|
| 1 Week Disconnected Devices Report |
|
| Disconnections by Minute Chart |
|
| Ping Failures by Minute Chart |
|
| Switchprobe (analysis) Reports |
|
| Utilities |
|
| Device Editor |
|
| KPI Management |
|
| Create a 'clean' database with existing ranges |
|
| Vendor Name Management |
|
| DeviceInfo Popup |
|